We’ve transformed tax-free portfolios for your HNW and high-income clients.
As a fiduciary, you can’t ignore this innovation.
You don’t want one of your top clients to say:
“I learned about an investment program that is
tax free in all respects,
is open architecture, and highly efficient.
An advisor manages it.
Why didn’t I hear this from you?”
THREE INNOVATIONS
…THAT INCREASE CLIENT PROFITABILITY AND WEALTH,
WHILE ADVANCING YOUR PRACTICE.
1
IMPROVE PERFORMANCE
A tax-free portfolio you build, manage, and monitor using your firm’s preferred investments.
2
ENHANCE WEALTH PLANS
Freely access portfolio value – tax free – for a variety of important wealth planning applications.
3
A PRACTICE BOOSTER
AUM growing for decades; build relationships with beneficiaries (children and charities).

IMAGINE…
A diversified portfolio structure, net of costs, that has the federal and state governments actually paying your HNW, high-income clients (through tax savings) to increase family wealth by millions of dollars (through a death benefit).
This is advisor-applied variable universal life (AAVUL).
Experienced PPLI Practitioners
Investment Product Firms
IMAGINING LEADS TO AAVUL INNOVATION
CALCULATE AAVUL CLIENT PROFITABILITY
Use these calculators to assess AAVUL’s profitability based on your top clients’ tax bracket and portfolio return targets
![]()
AAVUL Tax
Shield Benefit
Check the target portfolio return
to earn a desired AAVUL profit
Interpretation A HNW client in the 35% blended tax bracket needs to achieve a AAVUL portfolio return of 4.29% to earn a tax profit of $0.00 for each dollar paid in policy expenses (at 1.5% policy costs to portfolio value).
Inputs
Results
This requires an integration of: Blended Federal/State Tax Rate Rate of Return 15% 10.00% 20% 7.50% 25% 6.00% 30% 5.00% 35% 4.29% 40% 3.75% 45% 3.33% 50% 3.00% 55% 2.73% 60% 2.50%
Details
Rate of Return Gross Portofolio Value Gross Profit Total Taxes After-Tax Profit Total Policy Expenses After-Policy-Expenses Profit AAVUL Profit Net of Policy Expenses Tax Shield Ratio(TSR) Tax Savings to Total Taxes Paid 10.00% $1,100,000 $100,000 $15,000 $85,000 $15,000 $85,000 $0.00 1.00 $0.00 7.50% $1,075,000 $75,000 $15,000 $60,000 $15,000 $60,000 $0.00 6.00% $1,060,000 $60,000 $15,000 $45,000 $15,000 $45,000 $0.00 5.00% $1,050,000 $50,000 $15,000 $35,000 $15,000 $35,000 $0.00 4.29% $1,042,857 $42,857 $15,000 $27,857 $15,000 $27,857 $0.00 3.75% $1,037,500 $37,500 $15,000 $22,500 $15,000 $22,500 $0.00 3.33% $1,033,333 $33,333 $15,000 $18,333 $15,000 $18,333 $0.00 3.00% $1,030,000 $30,000 $15,000 $15,000 $15,000 $15,000 $0.00 2.73% $1,027,273 $27,273 $15,000 $12,273 $15,000 $12,273 $0.00 2.50% $1,025,000 $25,000 $15,000 $10,000 $15,000 $10,000 $0.00
![]()
AAVUL Tax
Shield Ratio
See how portfolio return and costs
mix to produce client profits
Inputs
Results
Blended Federal and State Tax Rate Pre-Tax Rate of Return Blended Federal and State Tax Rate 1% 2% 3% 4% 5% 6% 7% 8% 9% 10% 11% 12% 13% 14% 15% 16% 17% 18% 19% 20% 15% 0.15 0.30 0.45 0.60 0.75 0.90 1.05 1.20 1.35 1.50 1.65 1.80 1.95 2.10 2.25 2.40 2.55 2.70 2.85 3.00 15% 16% 0.16 0.32 0.48 0.64 0.80 0.96 1.12 1.28 1.44 1.60 1.76 1.92 2.08 2.24 2.40 2.56 2.72 2.88 3.04 3.20 16% 17% 0.17 0.34 0.51 0.68 0.85 1.02 1.19 1.36 1.53 1.70 1.87 2.04 2.21 2.38 2.55 2.72 2.89 3.06 3.23 3.40 17% 18% 0.18 0.36 0.54 0.72 0.90 1.08 1.26 1.44 1.62 1.80 1.98 2.16 2.34 2.52 2.70 2.88 3.06 3.24 3.42 3.60 18% 19% 0.19 0.38 0.57 0.76 0.95 1.14 1.33 1.52 1.71 1.90 2.09 2.28 2.47 2.66 2.85 3.04 3.23 3.42 3.61 3.80 19% 20% 0.20 0.40 0.60 0.80 1.00 1.20 1.40 1.60 1.80 2.00 2.20 2.40 2.60 2.80 3.00 3.20 3.40 3.60 3.80 4.00 20% 21% 0.21 0.42 0.63 0.84 1.05 1.26 1.47 1.68 1.89 2.10 2.31 2.52 2.73 2.94 3.15 3.36 3.57 3.78 3.99 4.20 21% 22% 0.22 0.44 0.66 0.88 1.10 1.32 1.54 1.76 1.98 2.20 2.42 2.64 2.86 3.08 3.30 3.52 3.74 3.96 4.18 4.40 22% 23% 0.23 0.46 0.69 0.92 1.15 1.38 1.61 1.84 2.07 2.30 2.53 2.76 2.99 3.22 3.45 3.68 3.91 4.14 4.37 4.60 23% 24% 0.24 0.48 0.72 0.96 1.20 1.44 1.68 1.92 2.16 2.40 2.64 2.88 3.12 3.36 3.60 3.84 4.08 4.32 4.56 4.80 24% 25% 0.25 0.50 0.75 1.00 1.25 1.50 1.75 2.00 2.25 2.50 2.75 3.00 3.25 3.50 3.75 4.00 4.25 4.50 4.75 5.00 25% 26% 0.26 0.52 0.78 1.04 1.30 1.56 1.82 2.08 2.34 2.60 2.86 3.12 3.38 3.64 3.90 4.16 4.42 4.68 4.94 5.20 26% 27% 0.27 0.54 0.81 1.08 1.35 1.62 1.89 2.16 2.43 2.70 2.97 3.24 3.51 3.78 4.05 4.32 4.59 4.86 5.13 5.40 27% 28% 0.28 0.56 0.84 1.12 1.40 1.68 1.96 2.24 2.52 2.80 3.08 3.36 3.64 3.92 4.20 4.48 4.76 5.04 5.32 5.60 28% 29% 0.29 0.58 0.87 1.16 1.45 1.74 2.03 2.32 2.61 2.90 3.19 3.48 3.77 4.06 4.35 4.64 4.93 5.22 5.51 5.80 29% 30% 0.30 0.60 0.90 1.20 1.50 1.80 2.10 2.40 2.70 3.00 3.30 3.60 3.90 4.20 4.50 4.80 5.10 5.40 5.70 6.00 30% 31% 0.31 0.62 0.93 1.24 1.55 1.86 2.17 2.48 2.79 3.10 3.41 3.72 4.03 4.34 4.65 4.96 5.27 5.58 5.89 6.20 31% 32% 0.32 0.64 0.96 1.28 1.60 1.92 2.24 2.56 2.88 3.20 3.52 3.84 4.16 4.48 4.80 5.12 5.44 5.76 6.08 6.40 32% 33% 0.33 0.66 0.99 1.32 1.65 1.98 2.31 2.64 2.97 3.30 3.63 3.96 4.29 4.62 4.95 5.28 5.61 5.94 6.27 6.60 33% 34% 0.34 0.68 1.02 1.36 1.70 2.04 2.38 2.72 3.06 3.40 3.74 4.08 4.42 4.76 5.10 5.44 5.78 6.12 6.46 6.80 34% 35% 0.35 0.70 1.05 1.40 1.75 2.10 2.45 2.80 3.15 3.50 3.85 4.20 4.55 4.90 5.25 5.60 5.95 6.30 6.65 7.00 35% 36% 0.36 0.72 1.08 1.44 1.80 2.16 2.52 2.88 3.24 3.60 3.96 4.32 4.68 5.04 5.40 5.76 6.12 6.48 6.84 7.20 36% 37% 0.37 0.74 1.11 1.48 1.85 2.22 2.59 2.96 3.33 3.70 4.07 4.44 4.81 5.18 5.55 5.92 6.29 6.66 7.03 7.40 37% 38% 0.38 0.76 1.14 1.52 1.90 2.28 2.66 3.04 3.42 3.80 4.18 4.56 4.94 5.32 5.70 6.08 6.46 6.84 7.22 7.60 38% 39% 0.39 0.78 1.17 1.56 1.95 2.34 2.73 3.12 3.51 3.90 4.29 4.68 5.07 5.46 5.85 6.24 6.63 7.02 7.41 7.80 39% 40% 0.40 0.80 1.20 1.60 2.00 2.40 2.80 3.20 3.60 4.00 4.40 4.80 5.20 5.60 6.00 6.40 6.80 7.20 7.60 8.00 40% 41% 0.41 0.82 1.23 1.64 2.05 2.46 2.87 3.28 3.69 4.10 4.51 4.92 5.33 5.74 6.15 6.56 6.97 7.38 7.79 8.20 41% 42% 0.42 0.84 1.26 1.68 2.10 2.52 2.94 3.36 3.78 4.20 4.62 5.04 5.46 5.88 6.30 6.72 7.14 7.56 7.98 8.40 42% 43% 0.43 0.86 1.29 1.72 2.15 2.58 3.01 3.44 3.87 4.30 4.73 5.16 5.59 6.02 6.45 6.88 7.31 7.74 8.17 8.60 43% 44% 0.44 0.88 1.32 1.76 2.20 2.64 3.08 3.52 3.96 4.40 4.84 5.28 5.72 6.16 6.60 7.04 7.48 7.92 8.36 8.80 44% 45% 0.45 0.90 1.35 1.80 2.25 2.70 3.15 3.60 4.05 4.50 4.95 5.40 5.85 6.30 6.75 7.20 7.65 8.10 8.55 9.00 45% 46% 0.46 0.92 1.38 1.84 2.30 2.76 3.22 3.68 4.14 4.60 5.06 5.52 5.98 6.44 6.90 7.36 7.82 8.28 8.74 9.20 46% 47% 0.47 0.94 1.41 1.88 2.35 2.82 3.29 3.76 4.23 4.70 5.17 5.64 6.11 6.58 7.05 7.52 7.99 8.46 8.93 9.40 47% 48% 0.48 0.96 1.44 1.92 2.40 2.88 3.36 3.84 4.32 4.80 5.28 5.76 6.24 6.72 7.20 7.68 8.16 8.64 9.12 9.60 48% 49% 0.49 0.98 1.47 1.96 2.45 2.94 3.43 3.92 4.41 4.90 5.39 5.88 6.37 6.86 7.35 7.84 8.33 8.82 9.31 9.80 49% 50% 0.50 1.00 1.50 2.00 2.50 3.00 3.50 4.00 4.50 5.00 5.50 6.00 6.50 7.00 7.50 8.00 8.50 9.00 9.50 10.00 50% 51% 0.51 1.02 1.53 2.04 2.55 3.06 3.57 4.08 4.59 5.10 5.61 6.12 6.63 7.14 7.65 8.16 8.67 9.18 9.69 10.20 51% 52% 0.52 1.04 1.56 2.08 2.60 3.12 3.64 4.16 4.68 5.20 5.72 6.24 6.76 7.28 7.80 8.32 8.84 9.36 9.88 10.40 52% 53% 0.53 1.06 1.59 2.12 2.65 3.18 3.71 4.24 4.77 5.30 5.83 6.36 6.89 7.42 7.95 8.48 9.01 9.54 10.07 10.60 53% 54% 0.54 1.08 1.62 2.16 2.70 3.24 3.78 4.32 4.86 5.40 5.94 6.48 7.02 7.56 8.10 8.64 9.18 9.72 10.26 10.80 54% 55% 0.55 1.10 1.65 2.20 2.75 3.30 3.85 4.40 4.95 5.50 6.05 6.60 7.15 7.70 8.25 8.80 9.35 9.90 10.45 11.00 55% 56% 0.56 1.12 1.68 2.24 2.80 3.36 3.92 4.48 5.04 5.60 6.16 6.72 7.28 7.84 8.40 8.96 9.52 10.08 10.64 11.20 56% 57% 0.57 1.14 1.71 2.28 2.85 3.42 3.99 4.56 5.13 5.70 6.27 6.84 7.41 7.98 8.55 9.12 9.69 10.26 10.83 11.40 57% 58% 0.58 1.16 1.74 2.32 2.90 3.48 4.06 4.64 5.22 5.80 6.38 6.96 7.54 8.12 8.70 9.28 9.86 10.44 11.02 11.60 58% 59% 0.59 1.18 1.77 2.36 2.95 3.54 4.13 4.72 5.31 5.90 6.49 7.08 7.67 8.26 8.85 9.44 10.03 10.62 11.21 11.80 59% 60% 0.60 1.20 1.80 2.40 3.00 3.60 4.20 4.80 5.40 6.00 6.60 7.20 7.80 8.40 9.00 9.60 10.20 10.80 11.40 12.00 60% 61% 0.61 1.22 1.83 2.44 3.05 3.66 4.27 4.88 5.49 6.10 6.71 7.32 7.93 8.54 9.15 9.76 10.37 10.98 11.59 12.20 61% 62% 0.62 1.24 1.86 2.48 3.10 3.72 4.34 4.96 5.58 6.20 6.82 7.44 8.06 8.68 9.30 9.92 10.54 11.16 11.78 12.40 62% 63% 0.63 1.26 1.89 2.52 3.15 3.78 4.41 5.04 5.67 6.30 6.93 7.56 8.19 8.82 9.45 10.08 10.71 11.34 11.97 12.60 63% 64% 0.64 1.28 1.92 2.56 3.20 3.84 4.48 5.12 5.76 6.40 7.04 7.68 8.32 8.96 9.60 10.24 10.88 11.52 12.16 12.80 64% 65% 0.65 1.30 1.95 2.60 3.25 3.90 4.55 5.20 5.85 6.50 7.15 7.80 8.45 9.10 9.75 10.40 11.05 11.70 12.35 13.00 65% 66% 0.66 1.32 1.98 2.64 3.30 3.96 4.62 5.28 5.94 6.60 7.26 7.92 8.58 9.24 9.90 10.56 11.22 11.88 12.54 13.20 66% 67% 0.67 1.34 2.01 2.68 3.35 4.02 4.69 5.36 6.03 6.70 7.37 8.04 8.71 9.38 10.05 10.72 11.39 12.06 12.73 13.40 67% 68% 0.68 1.36 2.04 2.72 3.40 4.08 4.76 5.44 6.12 6.80 7.48 8.16 8.84 9.52 10.20 10.88 11.56 12.24 12.92 13.60 68% 69% 0.69 1.38 2.07 2.76 3.45 4.14 4.83 5.52 6.21 6.90 7.59 8.28 8.97 9.66 10.35 11.04 11.73 12.42 13.11 13.80 69% 70% 0.70 1.40 2.10 2.80 3.50 4.20 4.90 5.60 6.30 7.00 7.70 8.40 9.10 9.80 10.50 11.20 11.90 12.60 13.30 14.00 70%
![]()
AAVUL Cash Flow
Comparison
Compare taxable and AAVUL
cash flows year by year
Death Benefit Determined Using Age and Health Underwriting Factors
Inputs
Results
Gross Return of Tax Inefficient Investments
Taxable Portfolio Analysis
AAVUL Portfolio as the Asset Location Resource
AAVUL Portfolio Tax Alpha Benefit
Yr.
Age
Non-MEC, Multi-Pay Premium Schedule
Net of Invest-ment Fee Return
Taxable Portfolio Cash Value Gross Return
After-Tax Return
Tax Rate on Portfolio Income
Tax Amount
Taxable Portfolio Cash Value After Taxes
Premium Taxes
Insurance Charges
Cumulative Annual Policy Fees
AAVUL Portfolio Cash Value After Policy Fees
AAVUL Net Cash Value Advantage Over Taxable
Additional After-Tax Return to Taxable Cash Value
Death Benefit
1 45 $250,000 3.00% $257,500 1.50% 1.50% $3,750 $253,750 $0 $3,750 $3,750 $253,750 $0 0.00% 2 46 $250,000 3.00% $522,725 1.50% 1.50% $7,556 $511,306 $0 $7,556 $7,556 $511,306 $0 0.00% 3 47 $250,000 3.00% $795,907 1.50% 1.50% $11,420 $772,726 $0 $11,420 $11,420 $772,726 $0 0.00% 4 48 $250,000 3.00% $1,077,284 1.50% 1.50% $15,341 $1,038,067 $0 $15,341 $15,341 $1,038,067 $0 0.00% 5 49 $0 3.00% $1,109,602 1.50% 1.50% $15,571 $1,053,638 $0 $15,571 $15,571 $1,053,638 $0 0.00% 6 50 $0 3.00% $1,142,891 1.50% 1.50% $15,805 $1,069,442 $0 $15,805 $15,805 $1,069,442 $0 0.00% 7 51 $0 3.00% $1,177,177 1.50% 1.50% $16,042 $1,085,484 $0 $16,042 $16,042 $1,085,484 $0 0.00% 8 52 $0 3.00% $1,212,493 1.50% 1.50% $16,282 $1,101,766 $0 $16,282 $16,282 $1,101,766 $0 0.00% 9 53 $0 3.00% $1,248,867 1.50% 1.50% $16,526 $1,118,293 $0 $16,526 $16,526 $1,118,293 $0 0.00% 10 54 $0 3.00% $1,286,333 1.50% 1.50% $16,774 $1,135,067 $0 $16,774 $16,774 $1,135,067 $0 0.00% 11 55 $0 3.00% $1,324,923 1.50% 1.50% $17,026 $1,152,093 $0 $17,026 $17,026 $1,152,093 $0 0.00% 12 56 $0 3.00% $1,364,671 1.50% 1.50% $17,281 $1,169,374 $0 $17,281 $17,281 $1,169,374 $0 0.00% 13 57 $0 3.00% $1,405,611 1.50% 1.50% $17,541 $1,186,915 $0 $17,541 $17,541 $1,186,915 $0 0.00% 14 58 $0 3.00% $1,447,780 1.50% 1.50% $17,804 $1,204,719 $0 $17,804 $17,804 $1,204,719 $0 0.00% 15 59 $0 3.00% $1,491,213 1.50% 1.50% $18,071 $1,222,790 $0 $18,071 $18,071 $1,222,790 $0 0.00% 16 60 $0 3.00% $1,535,949 1.50% 1.50% $18,342 $1,241,131 $0 $18,342 $18,342 $1,241,131 $0 0.00% 17 61 $0 3.00% $1,582,028 1.50% 1.50% $18,617 $1,259,748 $0 $18,617 $18,617 $1,259,748 $0 0.00% 18 62 $0 3.00% $1,629,489 1.50% 1.50% $18,896 $1,278,645 $0 $18,896 $18,896 $1,278,645 $0 0.00% 19 63 $0 3.00% $1,678,373 1.50% 1.50% $19,180 $1,297,824 $0 $19,180 $19,180 $1,297,824 $0 0.00% 20 64 $0 3.00% $1,728,724 1.50% 1.50% $19,467 $1,317,292 $0 $19,467 $19,467 $1,317,292 $0 0.00% 21 65 $0 3.00% $1,780,586 1.50% 1.50% $19,759 $1,337,051 $0 $19,759 $19,759 $1,337,051 $0 0.00% 22 66 $0 3.00% $1,834,004 1.50% 1.50% $20,056 $1,357,107 $0 $20,056 $20,056 $1,357,107 $0 0.00% 23 67 $0 3.00% $1,889,024 1.50% 1.50% $20,357 $1,377,463 $0 $20,357 $20,357 $1,377,463 $0 0.00% 24 68 $0 3.00% $1,945,695 1.50% 1.50% $20,662 $1,398,125 $0 $20,662 $20,662 $1,398,125 $0 0.00% 25 69 $0 3.00% $2,004,065 1.50% 1.50% $20,972 $1,419,097 $0 $20,972 $20,972 $1,419,097 $0 0.00% 26 70 $0 3.00% $2,064,187 1.50% 1.50% $21,286 $1,440,384 $0 $21,286 $21,286 $1,440,384 $0 0.00% 27 71 $0 3.00% $2,126,113 1.50% 1.50% $21,606 $1,461,989 $0 $21,606 $21,606 $1,461,989 $0 0.00% 28 72 $0 3.00% $2,189,896 1.50% 1.50% $21,930 $1,483,919 $0 $21,930 $21,930 $1,483,919 $0 0.00% 29 73 $0 3.00% $2,255,593 1.50% 1.50% $22,259 $1,506,178 $0 $22,259 $22,259 $1,506,178 $0 0.00% 30 74 $0 3.00% $2,323,261 1.50% 1.50% $22,593 $1,528,771 $0 $22,593 $22,593 $1,528,771 $0 0.00% 31 75 $0 3.00% $2,392,959 1.50% 1.50% $22,932 $1,551,702 $0 $22,932 $22,932 $1,551,702 $0 0.00% 32 76 $0 3.00% $2,464,748 1.50% 1.50% $23,276 $1,574,978 $0 $23,276 $23,276 $1,574,978 $0 0.00% 33 77 $0 3.00% $2,538,690 1.50% 1.50% $23,625 $1,598,603 $0 $23,625 $23,625 $1,598,603 $0 0.00% 34 78 $0 3.00% $2,614,851 1.50% 1.50% $23,979 $1,622,582 $0 $23,979 $23,979 $1,622,582 $0 0.00% 35 79 $0 3.00% $2,693,296 1.50% 1.50% $24,339 $1,646,920 $0 $24,339 $24,339 $1,646,920 $0 0.00% 36 80 $0 3.00% $2,774,095 1.50% 1.50% $24,704 $1,671,624 $0 $24,704 $24,704 $1,671,624 $0 0.00% 37 81 $0 3.00% $2,857,318 1.50% 1.50% $25,074 $1,696,698 $0 $25,074 $25,074 $1,696,698 $0 0.00% 38 82 $0 3.00% $2,943,038 1.50% 1.50% $25,450 $1,722,149 $0 $25,450 $25,450 $1,722,149 $0 0.00% 39 83 $0 3.00% $3,031,329 1.50% 1.50% $25,832 $1,747,981 $0 $25,832 $25,832 $1,747,981 $0 0.00% 40 84 $0 3.00% $3,122,269 1.50% 1.50% $26,220 $1,774,201 $0 $26,220 $26,220 $1,774,201 $0 0.00%
GET EDUCATED ON AAVUL’S INNOVATIONS
Our thought leadership guides you . . . on practice management . . . portfolio building . . . legal/regulatory understanding
Tax Alpha E-Book
Learn how AAVUL is a one-step, comprehensive Tax Alpha solution

Portfolio and Investing E-Book
Learn why an open architecture, optimized portfolio is a vastly better solution than using an IDF

Legal/Regulatory Whitepaper
AdvisableWE’s investing and compliance technology transforms AAVUL portfolios and eliminates the risk that the valuable tax shield will be pierced
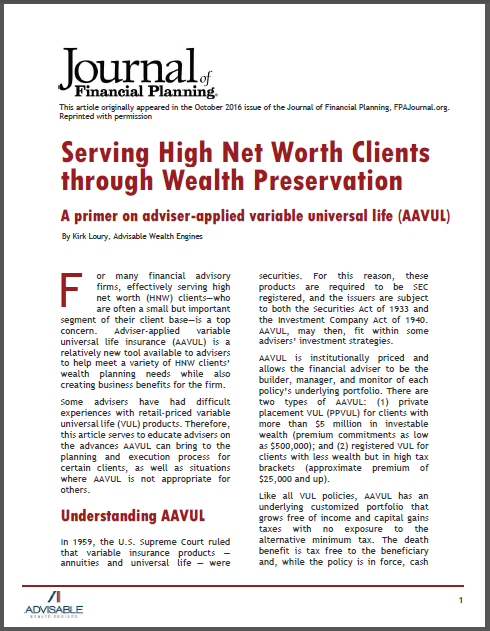
Journal of Financial Planning Article (10/2016)
Learn how AAVUL benefits advisors in delivering wealth management services
HOW TO USE AAVUL WITH HNW CLIENTS
You’ll be impressed how AAVUL’s tax-free cash access fuels a number of essential planning applications

“Insurance Like It Should Be; Benefits Without Barriers” Planning Applications Brochure
AAVUL’s tax-free portfolio and tax-free cash access advance several important wealth planning applications
SAMPLE CLIENT SCENARIOS

High-Income/Dual Career Family
Meet John & Catherine, Healthcare Successes

Wealthy Real Estate Investor
Meet Walt & Bernadette, Committed Real Estate Investors

Recent Divorcee
Meet Sandra, She’s Starting Anew

Retired Widower
Meet Alan, a Retired CEO
INSURANCE LIKE IT SHOULD BE
Benefits without Barriers
You’re most familiar with retail VUL and its drawbacks:
loads; high costs; complex products; investment limitations; a difficult sales process.
Check out our AAVUL partners’ solutions that keep VUL's benefits while removing the barriers.